Page 13 - QATALUM SUSTAINABILITY REPORT 2013
P. 13
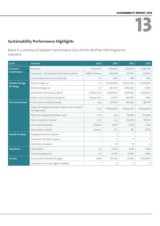
SUSTAINABILITY REPORT | 2013 13 Sustainability Performance Highlights below is a summary of Qatalum’s performance since 2011 for all of the sdir Programme indicators. 8,762 Indicator Unit 2011 2012 2013 Economic revenues usd ‘000 1,135,000 1,558,530 1,548,794 Contribution Production - broken down into main products million tonnes 468,789 627,971 634,351 Goods and services sourced locally % 30% 26% 47% Climate Change direct energy use GJ 25,300,808 29,322,066 32,464,858 & Energy indirect energy use GJ 240,703 4,032,461 8,762 direct GHG emissions (scope 1) tonnes co2 4,569,997 4,801,041 4,604,651 indirect GHG emissions (scope 2) tonnes co2 57,677 965,550 1,984 The Environment Fresh water used (purchased) m3 570,178 434,903 398,770 Water discharged (sea water used as non-contact m3 117,500,000 117,500,000 117,500,000 cooling water) Water discharged (other than sea) m3 n/a 55,000 120,860 Water recycled or reused m3 n/a 233,203 157,502 total waste disposed tonnes 4,679 3,729 7,784 total waste recycled tonnes 337 145 8,178 health & Safety employee lost time injuries - 1 1 1 contractor lost time injuries - 2 5 0 Heat stress incidents - 14 10 4 Workforce Qatarisation % 2.70% 4.3% 4.6% Female employment % 4.73% 4.40% 3.91% Society total social investment budget usd 30,540 45,249 1,000,000 corruption or human rights incidents - 0 0 0