Page 22 - QATALUM SUSTAINABILITY REPORT 2013
P. 22
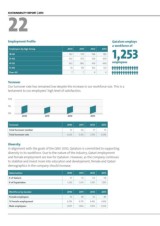
SUSTAINABILITY REPORT | 2013 22 Employment Profle Qatalum employs a workforce of Employees by Age Group 2010 2011 2012 2013 18-30 182 179 198 189 1,253 31-40 542 553 528 493 41-50 362 386 414 444 employees 51-60 74 99 105 123 Over 60 7 7 4 4 Turnover our turnover rate has remained low despite the increase in our workforce size. this is a testament to our employees’ high level of satisfaction. 10% 5% 0% 2010 2011 2012 2013 Turnover 2010 2011 2012 2013 Total turnover number 72 65 71 75 Total turnover rate 6.2% 5.3% 5.7% 6.0% Diversity in alignment with the goals of the QnV 2030, Qatalum is committed to supporting diversity in its workforce. due to the nature of the industry, Qatari employment and female employment are low for Qatalum. However, as the company continues to stabilize and invest more into education and development, female and Qatari demographics in the company should increase. Qatarization 2010 2011 2012 2013 # of Qataris 37 33 54 58 # of Expatriates 1,130 1,191 1,195 1,195 Workforce by Gender 2010 2011 2012 2013 Female employees 70 58 55 49 % Female employment 6.0% 4.7% 4.4% 4.6% Male employees 1,097 1,166 1,194 1,204